I've been going through various Dynamo tutorials that have been sitting patiently on my hard drive waiting for me to finally "find the time" I enjoyed building this simple graph that throws out a range of numbers, uses them to place points in a row and then wiggles one of those rows by feeding a sine wave into the Y axis.

One way to check if you absorbed an idea is to reapply it to a slightly different situation, so I turned the whole thing on its side and wiggled both rows to create a rippling surface. This is all done with Dynamo running on top of a conceptual mass family: Point World, because I'm using points.

So when you switch off Dynamo, or save out the family to an RFA, you end up with a frozen wiggly surface, which you can use for "Roof by Face" and of course you can go back to Dynamo any time to thaw out your surface and use the sliders to quickly generate multiple variants. In this case I have six active sliders, including different amplitude controls for left and right.

I think I forgot to put in a width slider, but that could be added. Maybe I should do a "node to code" while I'm at it and produce a black box with 7 input sliders and a single output. But instead I got carried away with the resemblence to the little school house that Gaudi built in the corner of the Sagrada Familia building site. This is not it, but rather a fantasy building inspired by the same idea.

Just before the weekend began I was talking to one of my good friends in the office, a young Egyptian architect with a passion for design, and we chewed over a concept for a tower built with modular units that seem to converge from all points of the compass and stack themselves up into a digital ant-hill. It seemed like an interesting challenge for a dynamo novice like myself.

I started with the function that Zach used in the session I attended at AU. He used it to make a truss. I want to thread beads along a string. First step is to test out that concept. It's easy enough, and the family doesn't have to be Point World based. This is a Generic Model starter family that I use to save a bit of time setting up reference planes and parameters: just a box. Draw a curve directly in Revit. Select it and press run, you get a row of beads which responds to a slider controlling how many there are. (0..1..#divisions) Pretty much like using Normalised Curve Parameter and a Repeater in Point World, but the repeated element doesn't have to be an Adaptive Component.

Next we have to flip this into the vertical plane, then use a more complex curve. A point-based spline in this case. In fact let's have 2 or 3 of them converging on the family origin and shooting up vertically like the graph of human social development that we all know and love.

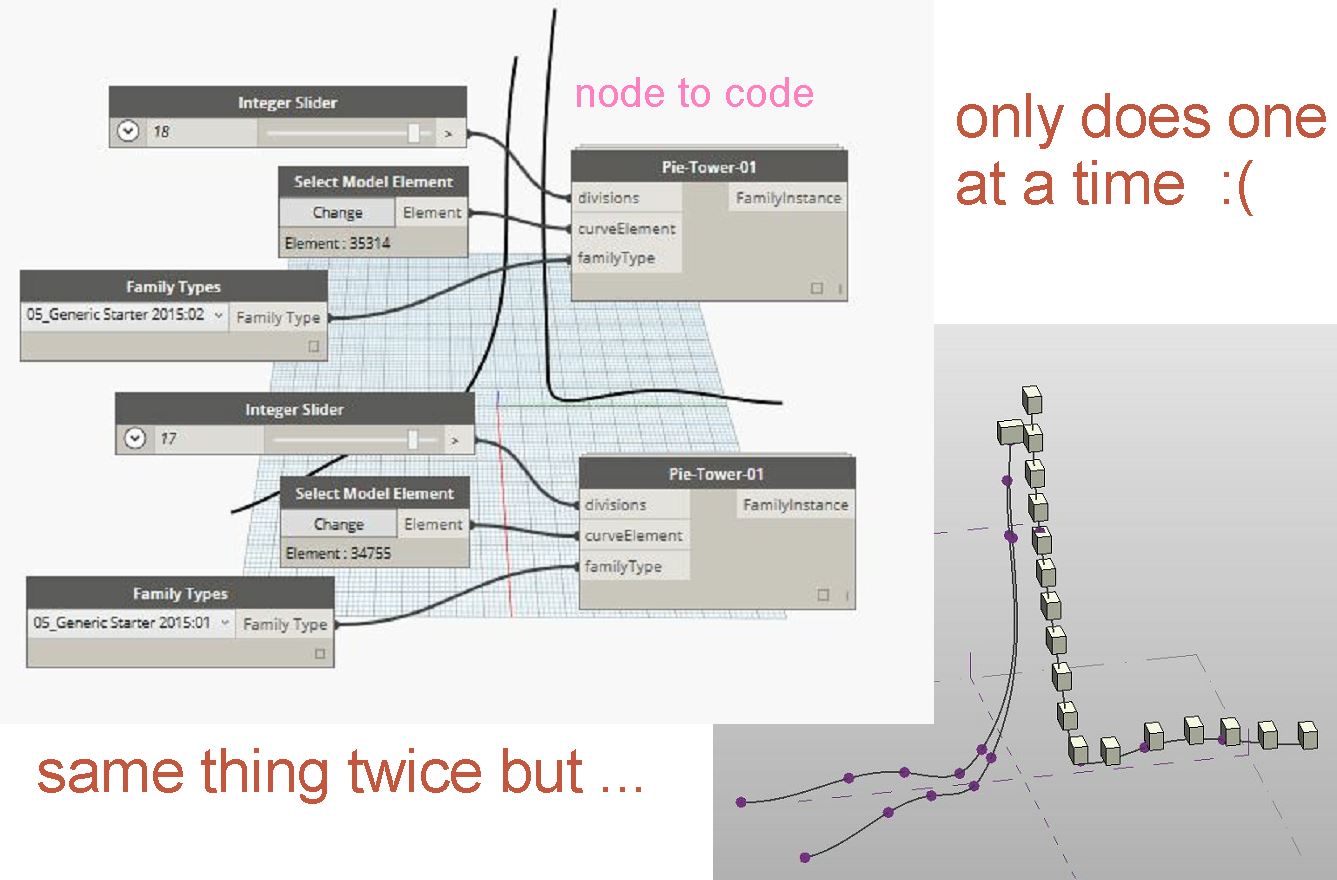
Problem is, I can only select one curve at a time. Even if I duplicate the whole arrangement, it only seems to deal with one output at a time.

There may be other solutions to this (for all I know, which isn't much) but the one I blundered into involves making a list. I have it on good authority that lists are "huge" so that felt like a mini breakthrough. Flatten the list to turn it back into one long stream, and it will go back into the "string of beads" routine not caring a wit that it is jumping from spline to spline every 20 items or so.

I need more splines, so the graph starts to bulk up a bit. Lists don't care right ? Just keep adding another index. And it's starting to look like a thing. Except that I would like the modules to vary in their orientation, even if they just alternated. I can make a second type that switches width and length around. But how to tell me list to alternate between the two ?

I'm pretty sure there is a better way to do this, but I came up with generating a list of families that's at least as long as my list of locations. You can add in a couple of "count" nodes to keep track of the numbers. How do you turn two "select" nodes into a massive alternating list. I ran some tests first. Start with 4 then do a list of lists to get 16. That worked fine with ten items to place.

So I made a big lists of lists, 4 x 4 x 4 x 4 = 256, then flattened it. I'm sure someone is wincing out there, but that's OK, it works but feel free to send me a better solution, it's all about learning at present.

I added a void to make my module slightly more house-like, plus a couple of hand-placed custom types to represent plint and core elements. That's not bad. Worth sharing with my mate Islam in fact. Who sounded suitably impressed, but then you have to be polite on the social media.

So of course I got carried away and did one of my multi-layered render jobs, then gave myself a well-deserved break and played some guitar. New Years Resolutions kicking in. I even got around to using the amplifier. There was a scary amount of dust on my amp and the bag of spaghetti that goes with it. To be fair, fine dust accumulates very rapidly here, has to do with the desert.

It was during one of my middle-of-the-night brainstorm episodes that I took the self-assembling ant-hill a stage further. I realised that I needed more splines and it seemed sensible to group them. Why not use subcategories so that you can isolate a group and edit with less confusion ? We can colour code the lines.

I already have some lines that stop half way up. Standard practice for any radial pattern. Some of your lines have to stop short. They can't all continue to the middle, it's going to get too congested. So I came up with a "node to code" thing that condenses 4 selection inputs into a single box. And I'm going to try using 3 of these. That's 12 splines in total (average bit less than 20 modules per spline... I'm safe with my 256 alternating family types)
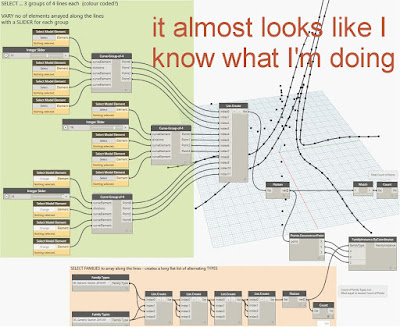
I can't believe how well-organised this graph looks. Each group has its own slider (shorter lines need fewer modules:) And I've been a good boy and added notes and comments. So how about the geometry itself ?
I'm looking to create a rig that makes it easier to adjust the splines. Maybe I want to adjust the angles between them, adjust the widths and heights. At the moment that's really messy work.

So I made a massing family that's just a single plane surface: X & Y axes plus a curve. You can draw a polyline using this surface as the Work Plane. Easy to rotate, you can even parametise the angles if you want. That's after you have assembled a bunch of them.

Actually, it was better to draw a polyline on one before copy-rotating them around. I have 3 different types of rig, colour coded to match the subcategories that the lines belong to. It still looks quite complicated, but much easier to adjust than it was before. Should be able to put a scale factor on the whole thing too.
Only took a couple of minutes to connect this up to my Dynamo graph and another couple for Dynamo to chug away and poplulate it. Adjustments are quite rapid, but first time you run it takes a bit longer.

I put some elements in for the podium and the core again, just manually placed, and I think I would need another family to create some rings of modules in the lower levels. It's too hollow down the bottom at present. This is just a conceptual representation. I'm not trying to think too hard about how each block is held up, but it shouldn't look too impossible. At present I have whole strings of beads hanging like they are on a chain. Not the intention.
Perhaps I don't need Dynamo for the inner sanctum family though. A few circular repeaters in an irregular cone shape will probably do the job. Give it a few parameters and stick it in there.

So I'm testing out a hybrid process. Dynamo is making a major contribution, Revit fluency forms the core (as always) and we've got some manual processes, judging things by eye. Then of course there is image processing so that we get eye candy to sit back and reflect on, share with others, spark things off in new directions.
Behind all this is an idea: kind of a literal interpretation of "Data Driven Design" Take a single line curve (rising temperatures, global polution, population of Africa) cross it with a pie chart (regional wealth distribution, market share of whatever, ...) and generate a building.

It's a bit silly, but that's never stopped me before. Maybe we could do something with Excel. Collect all the parameter values for the rigs (X, Y, rotation, etc) do bit of processing in Excel, then throw them back in. Could be a more powerful way to generate options.
At present I have just 2 different modules, but I have it set up so that it would be very fast to up that to 4, which may well be enough. Beyond that we would probably want to look at randomising the list a bit. Need to do that after flattening it I guess.
Maybe we will get into all that if Islam takes the bait. I'll let you know.

One way to check if you absorbed an idea is to reapply it to a slightly different situation, so I turned the whole thing on its side and wiggled both rows to create a rippling surface. This is all done with Dynamo running on top of a conceptual mass family: Point World, because I'm using points.

So when you switch off Dynamo, or save out the family to an RFA, you end up with a frozen wiggly surface, which you can use for "Roof by Face" and of course you can go back to Dynamo any time to thaw out your surface and use the sliders to quickly generate multiple variants. In this case I have six active sliders, including different amplitude controls for left and right.

I think I forgot to put in a width slider, but that could be added. Maybe I should do a "node to code" while I'm at it and produce a black box with 7 input sliders and a single output. But instead I got carried away with the resemblence to the little school house that Gaudi built in the corner of the Sagrada Familia building site. This is not it, but rather a fantasy building inspired by the same idea.

Just before the weekend began I was talking to one of my good friends in the office, a young Egyptian architect with a passion for design, and we chewed over a concept for a tower built with modular units that seem to converge from all points of the compass and stack themselves up into a digital ant-hill. It seemed like an interesting challenge for a dynamo novice like myself.

I started with the function that Zach used in the session I attended at AU. He used it to make a truss. I want to thread beads along a string. First step is to test out that concept. It's easy enough, and the family doesn't have to be Point World based. This is a Generic Model starter family that I use to save a bit of time setting up reference planes and parameters: just a box. Draw a curve directly in Revit. Select it and press run, you get a row of beads which responds to a slider controlling how many there are. (0..1..#divisions) Pretty much like using Normalised Curve Parameter and a Repeater in Point World, but the repeated element doesn't have to be an Adaptive Component.

Next we have to flip this into the vertical plane, then use a more complex curve. A point-based spline in this case. In fact let's have 2 or 3 of them converging on the family origin and shooting up vertically like the graph of human social development that we all know and love.

Problem is, I can only select one curve at a time. Even if I duplicate the whole arrangement, it only seems to deal with one output at a time.
There may be other solutions to this (for all I know, which isn't much) but the one I blundered into involves making a list. I have it on good authority that lists are "huge" so that felt like a mini breakthrough. Flatten the list to turn it back into one long stream, and it will go back into the "string of beads" routine not caring a wit that it is jumping from spline to spline every 20 items or so.

I need more splines, so the graph starts to bulk up a bit. Lists don't care right ? Just keep adding another index. And it's starting to look like a thing. Except that I would like the modules to vary in their orientation, even if they just alternated. I can make a second type that switches width and length around. But how to tell me list to alternate between the two ?

I'm pretty sure there is a better way to do this, but I came up with generating a list of families that's at least as long as my list of locations. You can add in a couple of "count" nodes to keep track of the numbers. How do you turn two "select" nodes into a massive alternating list. I ran some tests first. Start with 4 then do a list of lists to get 16. That worked fine with ten items to place.

So I made a big lists of lists, 4 x 4 x 4 x 4 = 256, then flattened it. I'm sure someone is wincing out there, but that's OK, it works but feel free to send me a better solution, it's all about learning at present.

I added a void to make my module slightly more house-like, plus a couple of hand-placed custom types to represent plint and core elements. That's not bad. Worth sharing with my mate Islam in fact. Who sounded suitably impressed, but then you have to be polite on the social media.

So of course I got carried away and did one of my multi-layered render jobs, then gave myself a well-deserved break and played some guitar. New Years Resolutions kicking in. I even got around to using the amplifier. There was a scary amount of dust on my amp and the bag of spaghetti that goes with it. To be fair, fine dust accumulates very rapidly here, has to do with the desert.

It was during one of my middle-of-the-night brainstorm episodes that I took the self-assembling ant-hill a stage further. I realised that I needed more splines and it seemed sensible to group them. Why not use subcategories so that you can isolate a group and edit with less confusion ? We can colour code the lines.

I already have some lines that stop half way up. Standard practice for any radial pattern. Some of your lines have to stop short. They can't all continue to the middle, it's going to get too congested. So I came up with a "node to code" thing that condenses 4 selection inputs into a single box. And I'm going to try using 3 of these. That's 12 splines in total (average bit less than 20 modules per spline... I'm safe with my 256 alternating family types)

I can't believe how well-organised this graph looks. Each group has its own slider (shorter lines need fewer modules:) And I've been a good boy and added notes and comments. So how about the geometry itself ?
I'm looking to create a rig that makes it easier to adjust the splines. Maybe I want to adjust the angles between them, adjust the widths and heights. At the moment that's really messy work.

So I made a massing family that's just a single plane surface: X & Y axes plus a curve. You can draw a polyline using this surface as the Work Plane. Easy to rotate, you can even parametise the angles if you want. That's after you have assembled a bunch of them.

Actually, it was better to draw a polyline on one before copy-rotating them around. I have 3 different types of rig, colour coded to match the subcategories that the lines belong to. It still looks quite complicated, but much easier to adjust than it was before. Should be able to put a scale factor on the whole thing too.
Only took a couple of minutes to connect this up to my Dynamo graph and another couple for Dynamo to chug away and poplulate it. Adjustments are quite rapid, but first time you run it takes a bit longer.

I put some elements in for the podium and the core again, just manually placed, and I think I would need another family to create some rings of modules in the lower levels. It's too hollow down the bottom at present. This is just a conceptual representation. I'm not trying to think too hard about how each block is held up, but it shouldn't look too impossible. At present I have whole strings of beads hanging like they are on a chain. Not the intention.
Perhaps I don't need Dynamo for the inner sanctum family though. A few circular repeaters in an irregular cone shape will probably do the job. Give it a few parameters and stick it in there.

So I'm testing out a hybrid process. Dynamo is making a major contribution, Revit fluency forms the core (as always) and we've got some manual processes, judging things by eye. Then of course there is image processing so that we get eye candy to sit back and reflect on, share with others, spark things off in new directions.
Behind all this is an idea: kind of a literal interpretation of "Data Driven Design" Take a single line curve (rising temperatures, global polution, population of Africa) cross it with a pie chart (regional wealth distribution, market share of whatever, ...) and generate a building.

It's a bit silly, but that's never stopped me before. Maybe we could do something with Excel. Collect all the parameter values for the rigs (X, Y, rotation, etc) do bit of processing in Excel, then throw them back in. Could be a more powerful way to generate options.
At present I have just 2 different modules, but I have it set up so that it would be very fast to up that to 4, which may well be enough. Beyond that we would probably want to look at randomising the list a bit. Need to do that after flattening it I guess.
Maybe we will get into all that if Islam takes the bait. I'll let you know.